



How Two Empty Rooms Change a Senior Housing Bid
How Two Empty Rooms Change a Senior Housing Bid
In a 100-unit community, two fewer occupied rooms can cut a buyer's bid by about $1.5 million.
Two fewer occupied rooms can take about $1.5 million off what I’d pay for a 100-unit senior housing community. That’s the difference between averaging 92 occupied rooms for the year and averaging 90 in the example below. The building still needs someone on the overnight shift either way.
I’d move existing senior housing communities up the diligence list. More Americans are reaching the ages when they may need care, and few new communities are opening. That gives established operators a chance to fill empty rooms. I’d pay a modest premium where the operator can show how much of the extra revenue it keeps after paying for care.
Why existing communities have an edge
Using the Census Bureau’s middle projection, our Q3 research puts the increase in Americans aged 80 and older at about 800,000 a year from 2026 through 2030. To turn that growth into occupied rooms, families still have to need care, be able to afford the monthly bill and choose a community over help at home.
American Healthcare REIT illustrates the supply side with a 2024 NIC MAP projection. If the same share of the 80-plus population lives in senior housing, projected construction would deliver about one in four of the new units needed to keep occupancy at 90% through 2030.
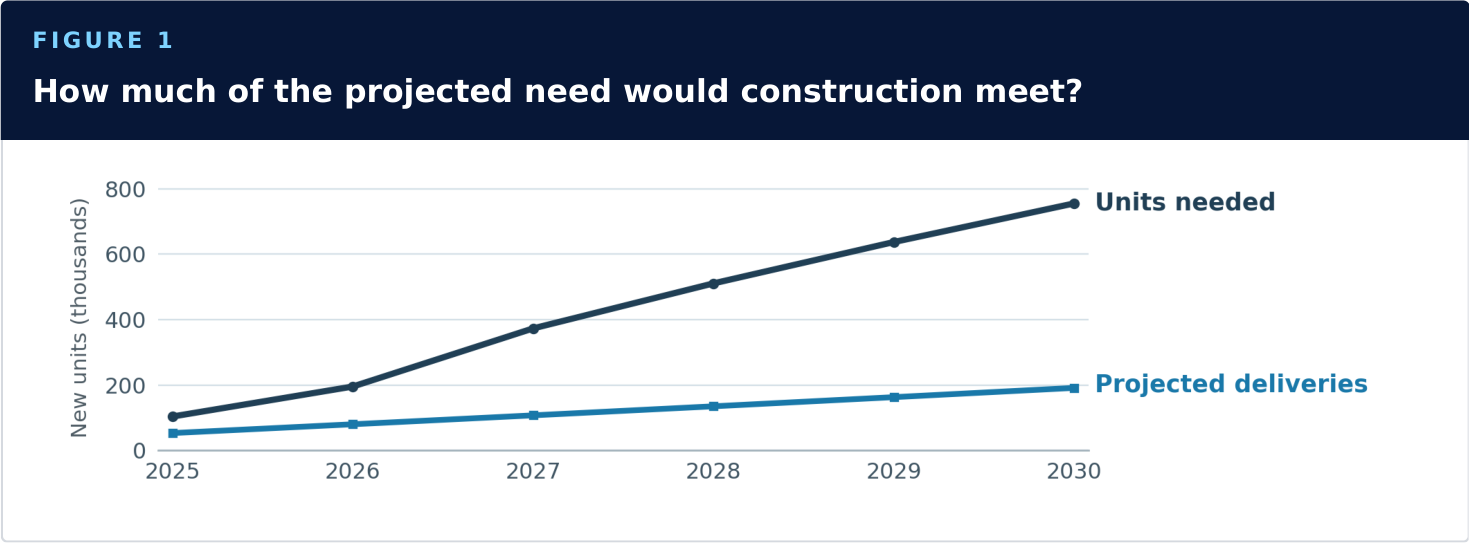
Both lines are projections from 2024. Faster construction or more families choosing care at home would narrow the gap.
Actual leasing points in the same direction. In the 31 primary markets NIC MAP tracks, about 4,600 more units were occupied in Q3 than in Q2. Occupancy reached roughly 90% while inventory grew less than 1% over the past year. For a specific property, I’d still check what’s being built within a family’s driving distance.
Sources Census population projections · American Healthcare REIT, slides 14–15 · NIC MAP outlook, p. 26 · NIC Q3 market data
Figure 1 uses Market evidence, B6:E12. The population calculation is in EM Capital’s Q3 research, p. 45.
PROPERTY OPERATIONS / WELLTOWER AND LTC
What a fuller building earns
Welltower gives us a way to test the bull case. Across the same senior housing properties, average occupancy rose from about 87% to 90% in the year through Q3 2026. Net operating income (NOI), the income left after property operating expenses, grew 21%.
More residents helped cover the cost of staffing buildings that were already open. Welltower also collected about 5% more per occupied room, while expense per occupied room rose less than 1%. Higher fees and changes in the care residents bought both affect revenue per room. The filing shows how the margin widened, but doesn’t separate the contribution of each cause.
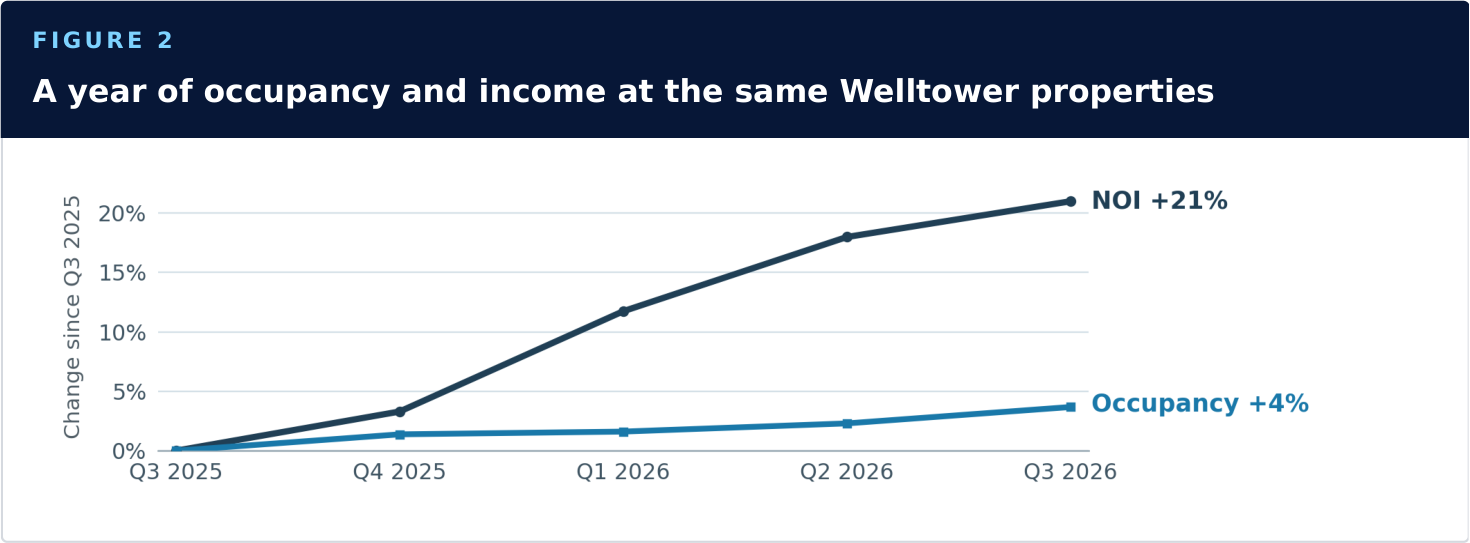
Both lines show percentage change from Q3 2025. Going from about 87% occupied to 90% is a gain of about three percentage points. The properties are in the US, UK and Canada.
Ventas also reported double-digit growth in same-store cash NOI in Q3. An owner can earn strong gains while rooms fill. A buyer taking over a nearly full community has fewer vacant rooms left to lease.
What three January purchases did to LTC’s growth rate
LTC Properties reported results for the same 27 communities in the first and second quarters of 2026. But it bought three of them partway through January. The second quarter has three full months of earnings. The reported first quarter leaves out the days before LTC owned them.
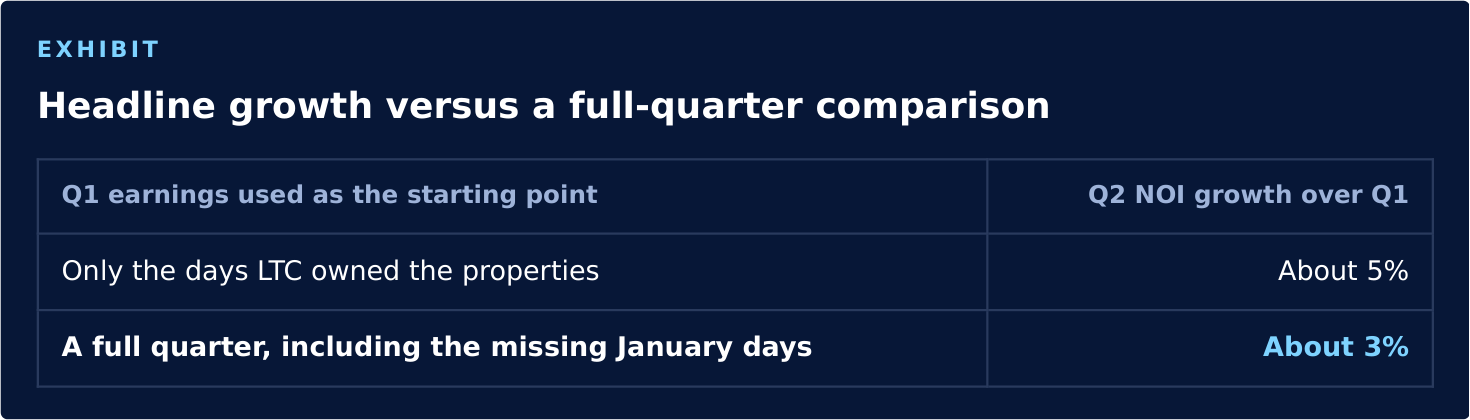
LTC supplied the income for those missing days. Putting it back leaves a real gain, roughly half as large as the headline comparison suggests. When a manager cites growth, I want the property list and purchase dates beside the income statements.
Sources Welltower Q3 supplement, p. 14 · Room revenue reconciliation · Ventas Q3 results · LTC Q2 supplement, p. 13
Figure 2 uses Operator evidence, B6:G17. The LTC comparison uses B45:E57 on the same tab. Both LTC rates compare one quarter with the preceding quarter.
UNDERWRITING / OCCUPANCY AND PRICE
What I’d pay when occupancy levels off
Take the 100-unit community from the opening. Each occupied room brings in $6,000 a month, and about $2,000 goes toward costs that vary with the resident. Each room therefore contributes $4,000 a month toward fixed expenses and NOI. If two rooms stay empty all year, the fee income disappears. Most of the staffing bill stays.
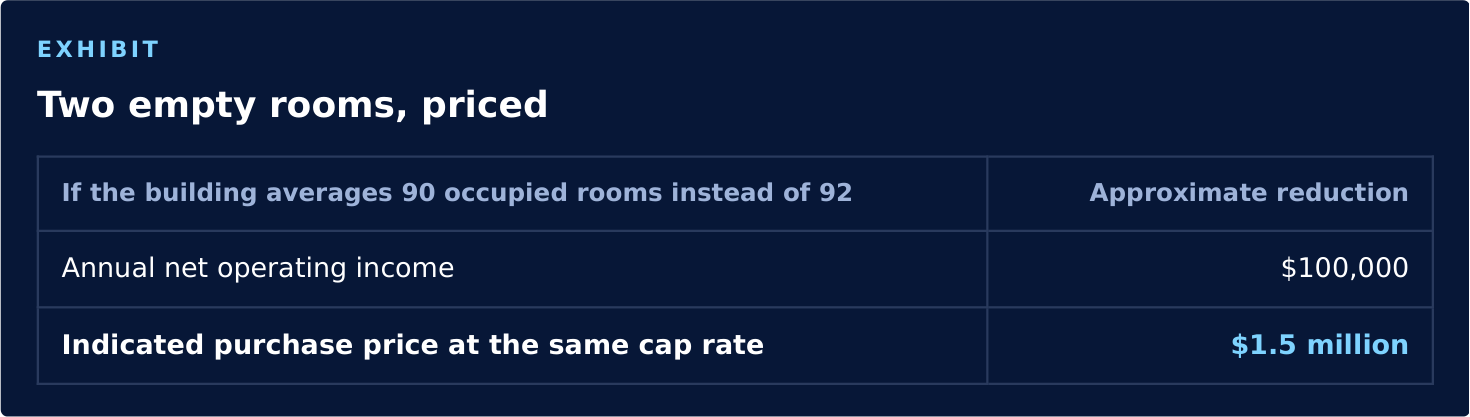
Illustrative direct capitalization at 6.55%, with $3 million of annual fixed costs. Excludes debt, transaction costs and capital expenditures. See Occupancy test, B8:E25, for the exact calculations.
I’d ask the operator for its shift roster at both occupancy levels. If the next resident requires another overnight caregiver, I’d put that person’s full cost into the bid. Averages can hide the cost of adding a shift.
THE INSIGHT Averages can hide the cost of adding a shift.
How much of the upside is in the price?
Our Q3 sector view is Accumulate. In our five-year model, senior housing earns about 10% a year before debt and fund fees, against an 8% normalized pricing benchmark. That assumes a 3.5% yield on the 10-year Treasury at sale and that buyers accept a cap rate about a quarter of a percentage point closer to Treasuries than the historical median. With a 4% Treasury at sale, the modeled return barely clears the benchmark.
Longer lives could mean longer stays. They could also mean families manage at home longer before moving in. AI-assisted monitoring could support either home care or community staff. The population projection already allows for changes in mortality. I’d give longevity or AI credit in the bid only after seeing additional occupied days in comparable communities or staffing savings after the cost of the technology.
My first request would be two years of monthly occupancy, collected fees and labor hours at nearby communities the operator runs. If new units are opening faster than residents are moving in, or wages are eating up fee increases, I’d lower my bid. Then I’d ask the operator, “The last time you ran two rooms below plan, what margin did you actually earn?”
FOR PAID SUBSCRIBERS
Paid research subscribers can use the companion workbook to change the occupancy, fees, costs and cap rate for their own property. It also includes the data behind both charts.
Subsricbe to The Allocation Desk to get the workbook
Pricing sources Cushman & Wakefield H1 2026 investor survey · EM Capital Q3 2026 cross-asset research, pp. 2, 4 and 6
Five-year annualized property returns are hypothetical and exclude fund fees and taxes. The normalized pricing benchmark is a sector comparison. The pricing cases appear in Occupancy test, B29:F44.
This edition is educational. The occupancy example is illustrative. Nothing here is investment advice, a recommendation, a valuation of any property or fund, or an offer of any security.

COMPANY
FOLLOW US
