



A Discount to NAV Still Needs Underwriting

A Discount to NAV Still Needs Underwriting
What to reconcile before a discount to reported NAV counts as an opportunity.
Suppose you are offered the equity in a private real estate position at 23% below its last stated value. What has to be reconciled before that discount counts as an opportunity?
A discount to NAV is incomplete evidence. Three things have to be separated first: what the property is worth, what debt and other obligations sit ahead of the investor, and what rights and liquidity terms attach to the specific interest being priced. Reported NAV, listed REIT pricing, and LP secondary prices each inform part of that chain. None of them is automatically correct.
In the hypothetical below, that 23% discount turns out to imply a 5.0% entry cap rate on the building. Whether that is a good price depends on the property and the cash flows the investor will receive. The size of the discount does not settle it.
Why the question is current
Nareit's September 3, 2026 commentary reports that, as of the second quarter of 2026, the cap rate implied by listed REIT pricing was 5.74%. The appraisal cap rate on properties held in NCREIF's ODCE funds, a set of open-end diversified core equity funds, was 4.47%. The gap is 127 basis points, and Nareit describes the divergence as having run a record 18 quarters.
Two qualifications. The width of the gap has moved: Nareit's July 7, 2026 mid-year update put the spread at 145 basis points and the run at 17 quarters, so duration and size are separate facts. The aggregate also conceals a wide range. Nareit's September 10, 2026 sector comparison puts the second-quarter differential at 194 basis points for office and 46 for retail.
The scope is narrower than "private real estate." The appraisal series covers properties in one set of core funds, not every private holding. Nareit's public Tracker summary reports the implied rate but does not provide enough methodological detail to reconcile the two series on a matched basis.
Separate what Nareit observes from what it concludes. The cap rates are observations. The September 3 piece says "appraisers and portfolio managers appear to be in a state of denial," and the September 10 piece says write-downs "are likely forthcoming for many ODCE properties." Those are interpretations, from an organization that describes itself as "the worldwide representative voice for REITs." The data deserve attention. The conclusion needs its own support.
On the LP side, Jefferies' Global Secondary Market Review for July 2026 reports average real estate LP portfolio pricing of 68% of NAV in the first half of 2026, against roughly 87% across all strategies. That is an advisor's average across portfolios. The NAV dates behind it are not disclosed, and it is not a bid for any particular holding.
All of this is a reason to challenge assumptions. It is not a price for any particular asset or interest.
Three values that are easy to blur
Start with the property. For a stabilized asset, value is approximately NOI divided by a supported cap rate, with the NOI period and definition matched to the comparison. A property in lease-up needs a fuller cash-flow model.
Fund equity comes next: the fund's share of property values and other assets, less property and fund debt, other liabilities, and accrued charges. Reported NAV is the vehicle's own measure of that equity under its valuation policies, and those policies differ. BREIT's offering terms, for example, describe a monthly NAV, annual third-party appraisals of its properties, and repurchases limited to 2% of NAV per month and 5% per quarter. Other vehicles differ, and the documents for the vehicle in question are the authority.
The LP interest is a third thing. It is a contractual position: a share class, a place in the distribution waterfall, fees and carried interest, unfunded commitments, transfer consent, and redemption or queue rules. A percentage stake does not automatically receive that percentage of every cash flow. A secondary price is also quoted against a reference NAV that may be a quarter or more old, so a discount stated without its NAV date and settlement adjustments cannot be evaluated.
Listed REIT pricing enters at a different point. A share price values common equity, so to compare it with property an analyst adds debt and other claims, removes cash and non-property assets, and compares the result with property income. That is the general logic of an implied cap rate, not a description of Nareit's calculation. Listed shares trade for real money, so their prices are evidence. They also reflect corporate overhead, financing access, growth options, and a property mix that may differ from the holding in question.
One caution runs the other way. A quoted LP price may already reflect illiquidity, fees, and expected capital calls. Those still need to be underwritten, but applying a further generic discount for the same risks counts them twice.
What an $8 million offer implies
Consider a hypothetical. One property produces $1 million of annual NOI and carries $12 million of debt, held fixed at par. An investor is offered all of the residual equity for $8 million. There are no other assets, obligations, fees, carry, taxes, capex, transaction costs, or unfunded commitments, and the minority LP rights and obligations described above are not priced. I use Nareit's two aggregate cap rates only as sensitivity inputs. They are not valuations of this property, and the offer is assumed, not observed.
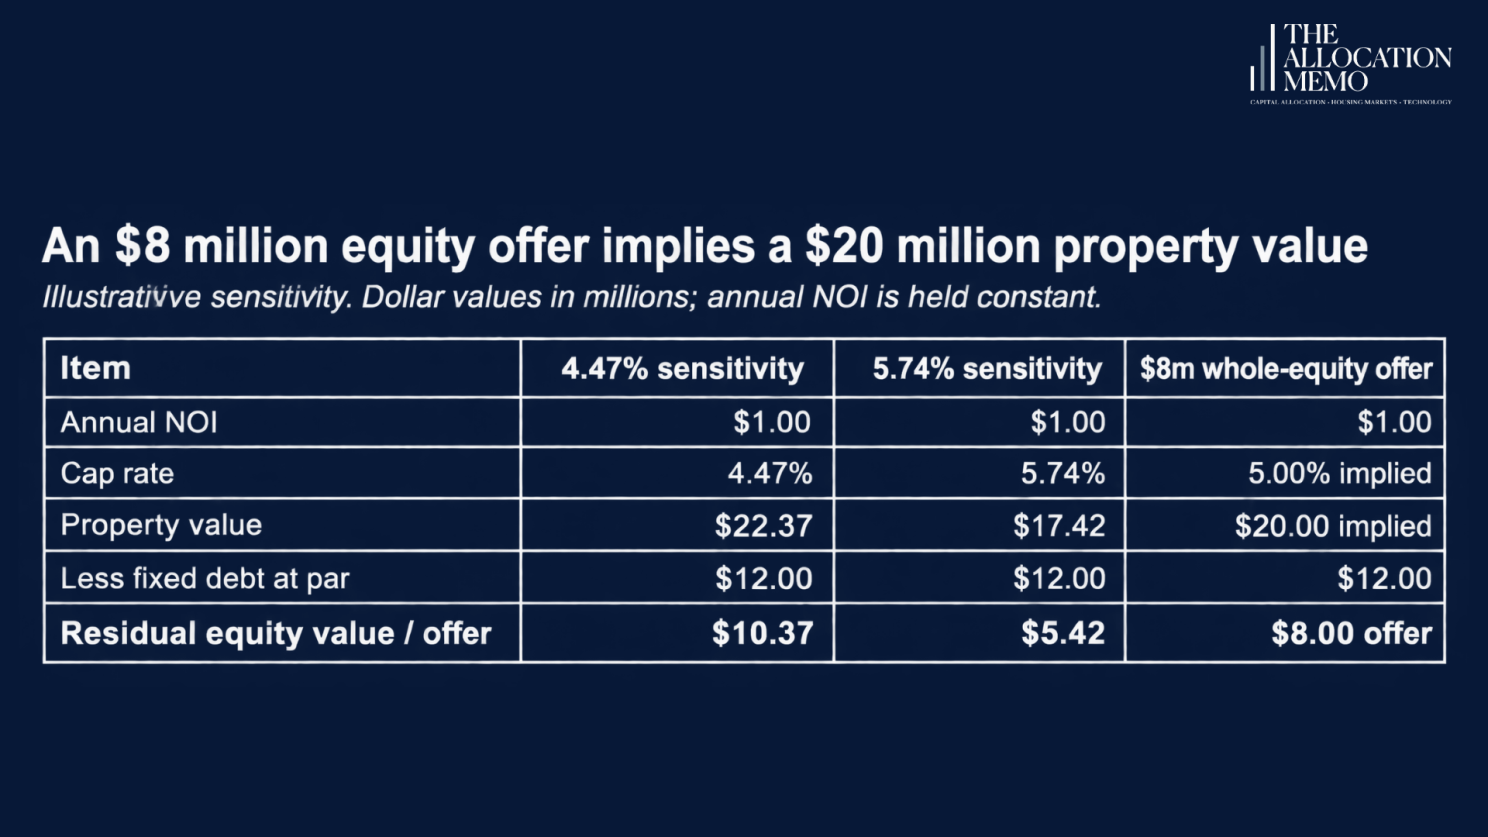
With fixed NOI and debt, moving between the two cap-rate inputs reduces property value by 22.1% and residual equity by 47.7%. The $8 million offer is 22.9% below the first equity estimate, but implies a 5.0% entry cap rate. At 5.74%, supporting the same $20 million property value requires $1.148 million of comparable annual NOI. Whether either assumption is defensible requires property-specific evidence.
Source: EM Capital illustrative calculations. The 4.47% and 5.74% inputs are the aggregate Q2 2026 rates reported in Nareit's September 3, 2026 commentary. Aggregate cap rates are illustrative sensitivity inputs, not a valuation or forecast for this property. The offer is assumed, not an observed bid or trade.
Assumptions: One hypothetical property; the investor acquires all residual equity; $1 million annual NOI on the same basis in each column; debt remains $12 million at par. No other assets or obligations, minority-interest adjustment, fees, carry, taxes, capex, transaction costs, or unfunded commitments. This whole-equity simplification is not a completed minority LP pricing model. Actual interest-level economics require the reconciliation described in the text.
The debt does not move, so the entire $4.95 million difference falls on equity. Equity is 46.36% of the first property value, which is why a 22.1% decline in the property value becomes a 47.7% decline in the equity.
Now the offer. Treat the first equity estimate as the stated value the discount is quoted against. At $8 million, the buyer pays 22.9% less than that figure. Add back the $12 million of debt and the price implies a $20 million property and a 5.0% entry cap rate before costs. That $20 million is 10.6% below the first property value. The same $8 million is also $2.58 million above the second equity estimate. One price is a 23% discount to one equity estimate, an 11% discount at the property level, and a premium to the other equity estimate. This is why a stated discount can change after reconciliation. Neither estimate is established as correct.
The 5.0% figure is a property yield at the implied purchase price. It is not an equity return, and it carries no information about interest expense, capital spending, fund charges, holding period, or exit value.
The arithmetic does produce a test. The implied $20 million holds if property-specific evidence supports a cap rate of 5.0% or lower on $1 million of NOI. Alternatively, at 5.74%, it takes $1.148 million of comparable annual NOI, 14.8% more than assumed. That is a static valuation threshold to check against leases and comparable sales. It is not a growth forecast or a return hurdle. If the higher income is reachable only later, the time, cost, and risk of getting there count against the price.
When the discount is an opportunity
The private value may be well supported, and the seller may simply need liquidity. A patient buyer can earn a real return from that. Listed REIT pricing reflects corporate economics and often a different asset mix, so an aggregate implied cap rate need not be the right rate for this building. The distance between Nareit's office and retail differentials shows how little one aggregate says about a single holding.
In its August 23, 2024 analysis of secondary transactions, Valuation Research Corporation argues that minority-interest and liquidity effects can help explain why an LP interest trades below reported NAV without establishing that the underlying asset values are wrong. That is a valuation firm's reasoning, not an independent test of any mark. The opposite shortcut fails too: a seller's wish for liquidity does not by itself make a trade distressed or its price irrelevant.
The conditions that change the answer are specific. In the example, strong leases, realizable income growth, attractive financing that survives the transfer, or comparable property sales at or below a 5.0% cap rate would support the entry price. Matched sales at higher cap rates without offsetting income, weaker collectible rents, required capital spending, unfavorable debt terms, or adverse LP rights would reduce it. The work is to change the relevant input and show the consequence, not to apply a universal haircut.
That case defeats any blanket rule that private assets should be marked to public aggregates. It does not remove the need to underwrite the purchase.
From a price to a commitment
A supportable entry value is necessary but not sufficient. The commitment decision rests on dated cash flows to the specific investor: distributions net of fees and carry, capital calls, required capital spending, debt service and refinancing, and net exit proceeds, in a base case and a plausible downside.
For a secondary purchase, the price ceiling is the present value of net distributions less future capital calls, discounted at the investor's required equity return, less acquisition costs. That return is the allocator's own hurdle, not a cap rate.
If the seller's price, before acquisition costs, is at or below that ceiling, the downside is acceptable, and future calls are fundable, the purchase may justify advancing to approval. If the price works only with unverified growth, unsupported exit pricing, or a refinancing that fails the downside case, the answer is to reprice, change terms, or decline. If the property evidence supports $20 million but net LP cash flows still miss the hurdle, the purchase passes the valuation test and fails the investment test.
A primary commitment is a different exercise. The capital may fund new assets rather than buy the existing portfolio, so deployment, fees, and draw timing need their own underwriting.
The same method for a position you already hold
For reporting, the question is whether the reported number can be reconciled. Ask for the NAV roll-forward for your interest, current property assumptions, the debt basis, and a dated explanation of differences from relevant market evidence. If documented changes explain the figure, report the manager's NAV with its date and basis. If a material gap stays unexplained, or a comparable orderly transaction challenges the mark, escalate through your valuation process and show the exposure in a separately labeled sensitivity. An unmatched public aggregate or a nonbinding indication is a reason to ask questions, not a replacement mark. Fair value standards such as IFRS 13 refer to an orderly transaction between market participants at the measurement date. Which standard governs depends on the vehicle.
For a sale, compare executable net proceeds with the present value of holding, using the same date and tax basis. Adjust the offer for its reference NAV, settlement terms, selling costs, taxes, and any obligations the seller retains. Discount delayed payments. Hold value is the present value of expected net distributions and eventual realization proceeds, less future calls. If the buyer assumes those calls, that relief is already reflected in the comparison. Do not also add it to the offer.
If net proceeds exceed a supported hold value, selling can be rational even at a large discount to NAV. If holding offers enough additional value and the investor can fund calls and wait, keeping the position can be rational despite an available bid.
Where a liquidity or concentration limit forces the decision, record the shortfall against hold value as the cost of liquidity, not as a view on property value. Include any redemption route with its queue timing and uncertainty. Reported NAV is not a promise of immediate redemption.
What the discount does and does not tell you
A discount to NAV is a starting observation. In the example, the same $8 million looked like a discount or a premium depending on the value it was measured against, and neither label said whether the purchase would earn its required return. What an investor buys is a defined set of cash flows and rights, after the obligations that come first. Test the actual price against those cash flows and the required return. When it reconciles, a discount can be a real opportunity. When the price is too high, a lower price or better terms can change the answer. The discount to reported NAV is only a reference point.
Sources and notes
Nareit, Edward F. Pierzak, Real Estate's "Triple D": Valuation Divergence, Denial, and Discounts, September 3, 2026. Q2 2026 REIT implied and ODCE appraisal cap rates; 18-quarter divergence. The author's interpretation is quoted and identified as such.
Nareit, Edward F. Pierzak and John Barwick, 2026 Mid-Year Update: REITs Rebound, Poised for Future Gains and Growth, July 7, 2026. 145-basis-point spread and 17-quarter duration on the data then current.
Nareit, Edward F. Pierzak, Ostrich Effect in Private Real Estate Valuations Contrasts with More Accurate REIT Pricing, September 10, 2026. Q2 2026 property-type differentials.
Nareit, REIT Industry Tracker, Q2 2026 results summary, accessed September 21, 2026. Reports a 5.7% implied cap rate and does not describe the calculation.
Jefferies, Global Secondary Market Review, July 2026, page 5. H1 2026 LP portfolio pricing. The report states its data are based on Jefferies-advised transactions and public non-Jefferies transactions.
BREIT, offering terms and disclosures, accessed September 21, 2026. One vehicle's terms, which can change. The current prospectus governs.
Valuation Research Corporation, John Czapla, Valuation Dynamics of Secondary Transactions, August 23, 2024. Practitioner analysis.
IFRS Foundation, IFRS 13 Fair Value Measurement, standard overview, accessed September 21, 2026.
Exhibit and all example figures: EM Capital calculations from the stated hypothetical inputs. Evidence cutoff: September 21, 2026.
This edition is educational. The example is hypothetical. Nothing here is investment advice, a recommendation, a valuation of any property or fund, or an offer of any security.
To see how we take a real estate question from evidence to conclusion, message me directly and ask for EM Capital's representative prior-period research issue.

COMPANY
FOLLOW US
