


You Don’t Need to Predict an AI Crash to Have an AI ProblemNew Blog Post
You Don’t Need to Predict an AI Crash to Have an AI Problem
The harder question is whether your diversifiers keep paying if the AI capital cycle slows.
Nvidia reported $96.2 billion of revenue for its fiscal second quarter, more than double the prior year. Management then said it expects revenue to grow approximately 70% in fiscal 2028, a preliminary outlook constrained by supply, not demand. The shares rose 8.74% the next day, outpacing both the S&P 500 and a semiconductor benchmark.[1]
Those numbers invite the familiar debate: Is Nvidia too expensive? Is AI a bubble? Can the spending continue? All are legitimate questions. None is the first allocation question.
If a client owns a capitalization-weighted U.S. equity portfolio, the portfolio already depends on the AI capital cycle. The more useful question is what else the client owns, and whether those assets are paid by a genuinely different economic engine if that cycle slows.
A correct Nvidia call can still produce a fragile portfolio
The concentration is visible before any AI taxonomy is applied. Bloomberg’s bottom-up reconstruction puts the ten largest S&P 500 constituents at 39.2% of index market value on 28 August 2026, below 40.6% at year-end 2025 but far above 26.7% in March 2000.[2] The largest name represented 7.5% of the index, versus 4.2% in March 2000, while the index’s effective breadth fell from about 81 holdings to 44. That does not mean only 44 stocks matter. It means today’s concentration is equivalent to an equal-weight portfolio of roughly 44 positions. The comparison uses full market capitalization consistently across periods because historical free-float data were not available for 2000.
There is an important counterpoint: today’s concentration is not pure narrative excess. On the current float-adjusted basis, the ten largest companies represent 39.5% of index value and 37.6% of trailing earnings.[13] Their market weight is broadly aligned with their profit share. That makes a reflexive bubble comparison weaker, but it does not solve the portfolio problem. Several of those profits and investment plans still respond to the same AI spending cycle.
The dependence extends beyond companies labeled “technology.” A conservative, evidence-verified classification identifies 15.65% of index weight in AI revenue sellers and directly quantified Tier 1 suppliers. A broader documented-sensitivity definition reaches 36.20% when disclosed capital spenders and management-described beneficiaries are included.[3] Those figures are not forecasts and should not be added together. They are different boundaries around the same portfolio question.
The relationship map also matters. The current evidence register contains 46 disclosed commercial, financing, equity-investment and customer relationships across the AI ecosystem; only ten are filing-grade.[4] There is no defensible single “circularity” total, and large customer contracts are not circular simply because they are large. But the network shows how a single capital-spending decision can travel through chip demand, cloud commitments, leases, power, financing and supplier revenues.
None of this proves that the largest companies are mispriced or that an AI correction is imminent. Concentration can persist when the underlying businesses produce a disproportionate share of profits, and the top ten’s weight has already declined from the December peak. What is historically unusual is not merely a large top-ten share. The largest constituent is almost 80% larger than the largest constituent in March 2000, and effective breadth has roughly halved. The portfolio concern is narrower: when one economic narrative influences the earnings, investment plans and financing needs of several large holdings at once, a client owns less independent risk than the number of line items suggests.
That distinction matters because the wrong response to concentration is often a forced valuation call. An allocator does not need to predict the end of the AI cycle to ask whether the rest of the portfolio is financed by the same customers and spending plans. Diversification is valuable precisely because the timing and direction of the dominant theme are uncertain.
That is why buying an asset with a different label is not automatically diversification. A data-center landlord, a private infrastructure fund and a public semiconductor stock may sit in different sleeves while depending on the same budget. Conversely, an asset can have an economically independent payer and still sell off with equities when liquidity disappears
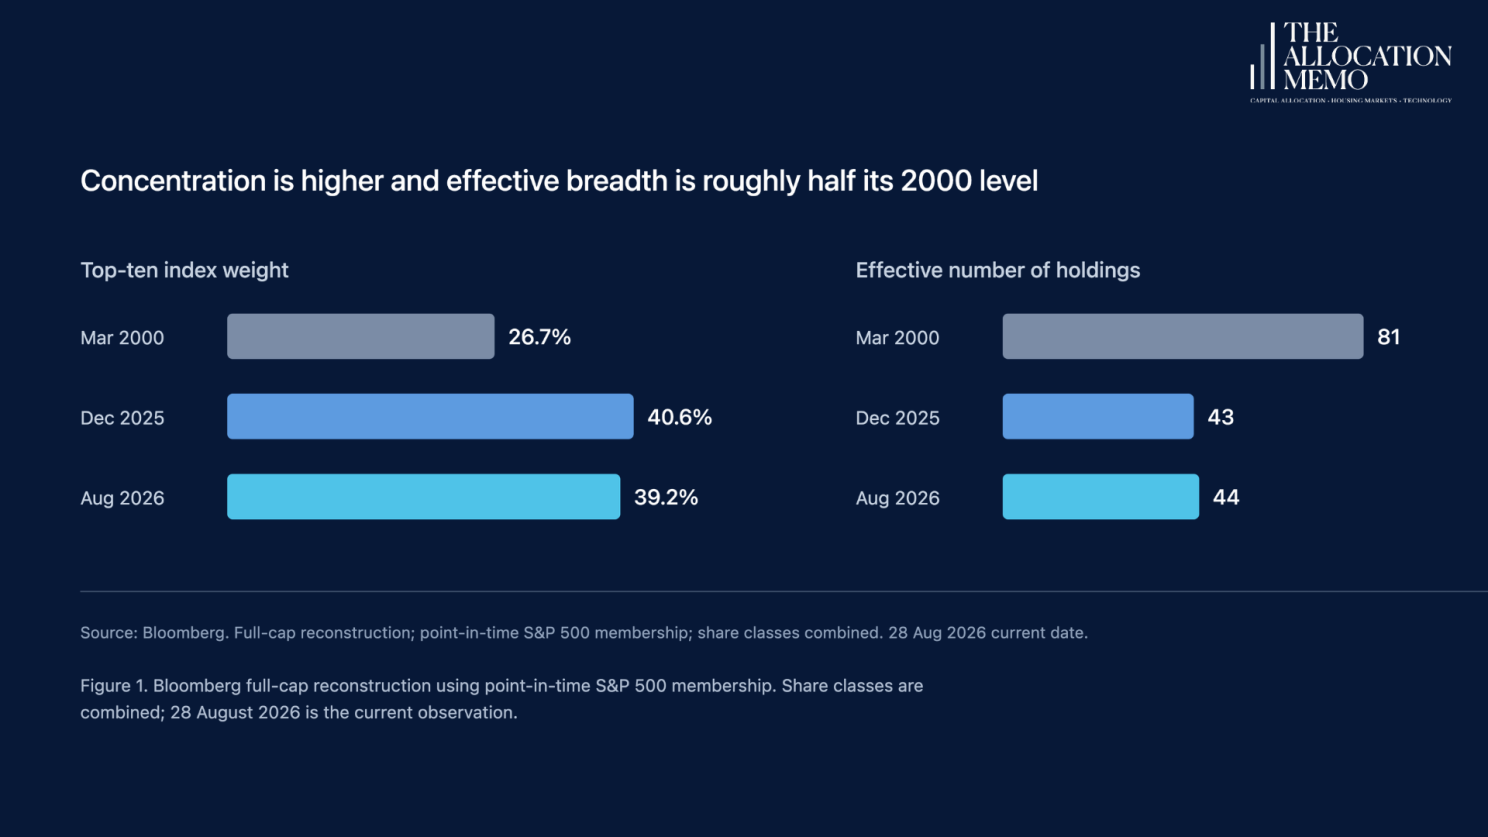
Bloomberg full-cap reconstruction using point-in-time S&P 500 membership. Share classes are combined; 28 August 2026 is the current observation.
The two-test screen
A diversifier should have to pass two separate tests.
Test 1: economic independence. Who ultimately pays the cash flow? The question is not whether an asset is public or private. It is whether its rent, coupon or operating income depends on the same AI investment budget already embedded in the equity portfolio.
Test 2: observed stress protection. How has the price or reported value behaved when broad equities have been under pressure? This is not the same as asking for a low full-period correlation. Downside capture estimates how much an asset lost across down months for each dollar lost by the S&P 500. Worst-quintile beta asks how market sensitivity changed in the S&P 500’s worst fifth of months. Drawdown, liquidity and valuation method also matter.
The tests must remain separate. A low beta can coexist with direct AI cash-flow dependence. An independent cash flow can coexist with a painful drawdown. Private marks can also mute reported volatility without changing the underlying economics. Only after both tests are understood should an allocator ask the third question: does the actual vehicle preserve the strategy’s diversification through its fees, leverage, liquidity, valuation and governance?
This is a higher burden than demanding zero correlation. Correlation changes across samples, and a diversifier can still be useful even when its listed price falls with equities for a period. The framework instead asks the allocator to be explicit about the job: is the holding meant to diversify the source of cash flow, protect near-term market value, provide liquidity in a drawdown, or deliver a return stream that can be rebalanced? A single asset rarely performs every role.
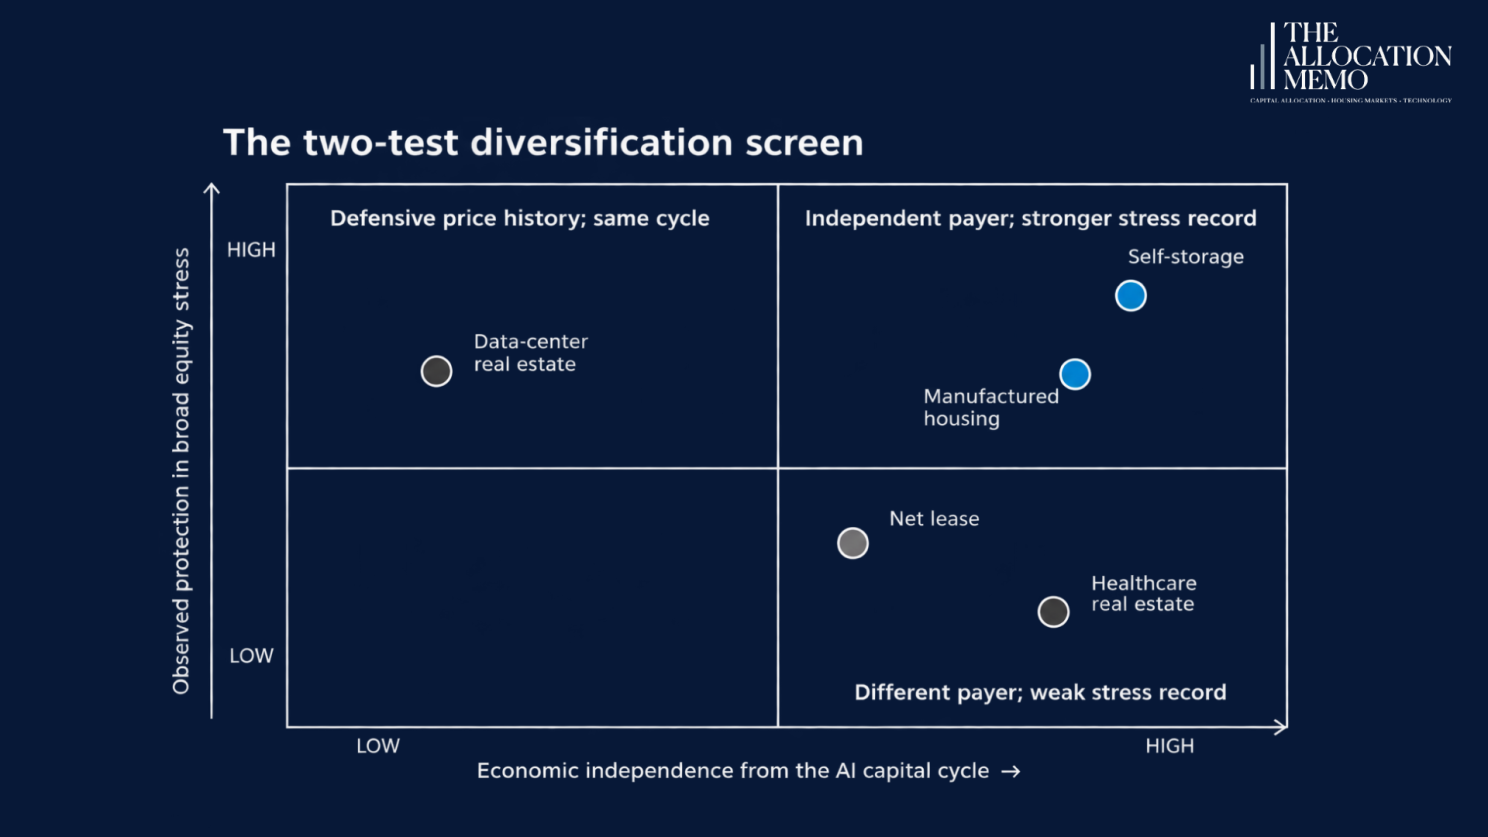
Positions combine payer analysis with official FTSE Nareit subsector total-return evidence. They are categorical judgments, not composite scores or forecasts. The data-center index begins in December 2015; other listed series begin in January 2014.
What happens when the screen is applied
Data-center real estate is the control case. It can look defensive in market data while remaining directly tied to the AI capital cycle. The official FTSE Nareit data-center index had a 0.46 correlation with SPY, 74% downside capture and a negative worst-quintile beta over its shorter December 2015 to August 2026 history.[13] That unusual tail estimate should not be overread: the sector lost 41.0% in the 2022 drawdown, versus 24.5% for SPY. Digital Realty’s 20 largest customers also accounted for approximately 51% of annualized recurring revenue at year-end 2025.[5] The payer map still says “same cycle,” even when selected price statistics look defensive.
Self-storage now has the strongest listed-sector evidence in the screen. Its payer is typically a household or small business, and its cash-flow link to AI is remote. The official sector index recorded 0.40 correlation, 65% downside capture and a 0.69 worst-quintile beta.[13] In plain English, it lost about 65 cents for each dollar SPY lost across down months. It also fell less than SPY in the COVID and 2022 windows, although it slightly underperformed during the 2023 regional-bank episode. This is useful diversification evidence, not a promise of crisis protection.
Manufactured housing also advances. Its official index posted 0.48 correlation, 70% downside capture and a 0.94 worst-quintile beta.[13] The resident homeowner paying ground rent is economically independent from the AI capital budget. But the sector fell more than SPY during COVID, 2022 and the regional-bank window, so the conclusion is narrower than the company-level screen first suggested. It diversifies the payer and has below-market sensitivity on average; it is not a reliable hedge in every stress.
Healthcare real estate produces the opposite combination. The payer is independent, but the official sector’s worst-quintile beta was 1.84 and its downside capture was 87%.[13] Net lease was similar: a 1.48 worst-quintile beta and 81% downside capture. Realty Income’s direct data-center exposure was only about 0.5% of annualized base rent at year-end 2025,[11] but low AI exposure did not make the listed sector defensive. Tenant credit, lease duration, leverage and portfolio mix still matter.
The official indexes were checked against monthly rebalanced baskets of the named companies. Monthly correlations between each index and basket ranged from 0.96 to 1.00, and betas differed by no more than 0.07.[13] That closes the earlier sector-evidence gap. It also changes the ranking: self-storage and manufactured housing offer the best combined evidence among the listed property sectors, while data centers remain the clearest example of why market behavior and payer independence must be judged separately.
Market hedges are not cash-flow diversifiers
The Bloomberg package also separates a traded-market hedge from an economically independent cash-flow strategy. Gold had a 0.09 correlation with SPY and negative 11% downside capture over the common sample, while intermediate Treasuries had a 0.11 correlation and 3% downside capture.[12] Those are the strongest public-market diversification statistics in the package. They are not regime-proof: gold lost 7.1% and intermediate Treasuries lost 15.4% during the 2022 drawdown window. Both can cushion a traded portfolio, but neither answers who pays the rent or coupon inside an alternatives allocation.
The same distinction cuts the other way. Utilities showed 31% downside capture and data centers showed relatively low full-period correlation, but neither was consistently defensive across the selected stress windows. Generic U.S. REITs, listed infrastructure, business development companies and mortgage REITs all had correlations near 0.71 to 0.72 with SPY; mortgage REIT downside capture reached 146%.[12] A category can therefore have an intuitive story and still fail the market-behavior test.
The strategies that remain unproven
Catastrophe bonds and residential mortgage credit are intellectually attractive because their cash flows are driven by insured perils and household mortgage performance rather than AI capital expenditure. But both remain provisional in the current evidence packet.
For catastrophe bonds, the market is still dominated by U.S. wind exposure, and the accessible vehicle history in hand is too short to establish stress behavior. The monthly Swiss Re index series, reproduced drawdowns, expected-loss data and vehicle-level liquidity terms are still missing.[8] For agency credit-risk transfer, the FHFA’s own conclusion is more important than a backtest: CRTs remain untested by a serious loss event.[9] From July 2013 through February 2021, the enterprises received roughly $0.05 billion through investor write-downs and counterparty reimbursements while paying about $15.0 billion in interest and premiums.[9] That shows the absence of a severe realized test, not proof of resilience.
Managed futures belong in a separate overlay conversation. Long-term evidence shows negative average stock correlation and stronger downside correlation, but the strategy did not contribute positively in every equity drawdown.[10] It may offer crisis convexity in some regimes; it does not pass the same cash-flow-payer test because it is a trading strategy rather than a contracted cash-flow asset.
The allocator’s implication
The practical mistake is to begin with a category such as “alternatives,” “real assets” or “private credit” and assume the label answers the portfolio question. It does not. Start with the risk already owned, then identify the transmission channel the diversifier is supposed to interrupt.
For every proposed diversifier, ask three things in order:
Who pays? Trace the rent, coupon or operating income to the end payer. Name the budget, industry or household cash flow that supports it.
What breaks? Use broad-equity stress, strategy-specific stress and liquidity stress. Do not allow a full-period correlation statistic to stand in for all three.
What survives the wrapper? Reconcile fees, leverage, gates, valuation, governance and return construction. A sound strategy inside a fragile vehicle is not the same allocation.
The answer can produce different portfolio roles from the same evidence. A healthcare property strategy may be useful because its tenants are not funded by AI budgets, while still requiring an equity-like loss budget. Self-storage may diversify operating income without functioning as a crisis hedge. A managed-futures program may improve rebalancing capacity in some drawdowns without owning a contracted cash-flow stream. The discipline is to name the role before selecting the vehicle, then judge success against that role.
The point is not to crown one permanent winner. It is to create a falsifiable allocation rule: new evidence about the payer, stress record or wrapper should be able to change the decision.
The goal is not to assemble a portfolio that cannot fall. It is to avoid paying several managers for the same underlying economic bet while believing the labels created independence.
Nvidia’s earnings may be the hook. The allocation question is who keeps paying when the AI capital cycle does not.
Sources and methodology
[1] NVIDIA Q2 FY2027 earnings release, 8-K/10-Q and 26 August 2026 earnings-call transcript; S&P Capital IQ closing-price data. Revenue +106% year over year; preliminary FY2028 outlook approximately +70%; D+1 NVDA +8.74%, S&P 500 +0.72%, SOXX +1.95%.
[2] Bloomberg Concentration Study Data, received 31 August 2026. Point-in-time S&P 500 membership and constituent market values reconstructed on a full-cap basis for comparability with 2000; share classes combined. 28 August 2026: top ten 39.243%, largest 7.455%, HHI 223.67 and effective N 43.8. March 2000: 26.678%, 4.193%, 123.59 and 80.9, respectively.
[3] Rogo S&P 500 AI Exposure Classification and QA closeout. 15.65% = independently verified and quantified lower bound; 36.20% = broader filing/management-disclosure sensitivity. The 57.66% maximum hypothesis envelope is excluded from the article.
[4] Rogo AI Ecosystem Financial Relationship Map and QA closeout. 46 evidenced edges; 10 filing-grade. Relationships are not aggregated into a single circularity number.
[5] Digital Realty 2025 Form 10-K: top 20 customers approximately 51% of annualized recurring revenue; 20 of 310 data centers occupied by single customers.
[6] Rogo AI-Cycle Strategy Screen v2; S&P Capital IQ monthly total-return series, common sample January 2014–August 2026; Definition A broad-stress threshold. Named-company observations, not property-sector index results.
[7] Equity LifeStyle Properties 2025 Form 10-K: core manufactured-housing base rental income +5.5%; rate +5.8%; occupancy −0.3%.
[8] Swiss Re, ILS Market Insights, February 2026. Peril mix and 2025 market statistics. Monthly index, expected-loss and accessible-vehicle evidence remain open.
[9] Federal Housing Finance Agency, report on Fannie Mae and Freddie Mac single-family credit-risk transfers. CRT serious-loss-event caveat; July 2013–February 2021 payment and write-down figures.
[10] Fidelity Institutional, Trend Following as Crisis Alpha; SG Trend Index statistics, December 2000–December 2025. Published summary statistics; monthly series remains license-gated.
[11] Realty Income 2025 Form 10-K: three data-center properties with $24.6 million of annualized base rent versus $5,310.5 million total portfolio annualized base rent; approximately 0.5%, calculated from disclosed figures.
[12] Bloomberg Concentration Study Data, cross-asset package. Daily gross total-return series with a common January 2014 to August 2026 history; 152 monthly observations for beta, correlation and downside capture versus SPY. Stress windows are defined in the workbook. Gold is XAU spot and intermediate Treasuries are represented by IEF.
[13] Bloomberg Concentration Study Data, updated property-sector and earnings package received 31 August 2026. Official FTSE Nareit total-return indexes for manufactured housing, self-storage, healthcare, free-standing/net lease, data centers and all-equity REITs. Monthly measures versus SPY through 28 August 2026; 152 observations except data centers, which begin 21 December 2015. Current float-adjusted top-ten weight is 39.521% versus 37.627% of LTM earnings.
Direct public references: NVIDIA filing | Digital Realty filing | FHFA CRT report | Swiss Re ILS insights
Method notes and limits
The concentration comparison uses Bloomberg full-cap weights because free-float history was unavailable for 2000. Current float-adjusted weights are higher, but they are not mixed into the historical comparison.
The updated real-estate analysis uses official FTSE Nareit subsector total-return indexes, cross-checked against monthly rebalanced baskets of named companies. Data centers have a shorter history beginning in December 2015.
Worst-quintile beta, downside capture and drawdown answer market-behavior questions. They do not prove cash-flow independence or future protection.
Private real-estate correlation is not compared directly with listed assets. NCREIF returns are quarterly and appraisal-based; the contemporaneous 0.03 correlation rises to about 0.20 with a one-quarter lag, and reported annualized volatility of 4.7% is smoothed.
Catastrophe bonds and agency CRT remain provisional. No vehicle recommendation or portfolio weight should be inferred.
The article deliberately excludes the maximum 57.66% AI-exposure hypothesis envelope, the recent 2026 n=1 AI stress observation, any aggregate circularity statistic and headline EPS-growth comparisons that mix GAAP and adjusted bases. The top-ten weight-versus-earnings comparison uses the same market-cap-ranked cohort.

COMPANY
FOLLOW US
