
The Real Asset Research Suite
EM Capital gives RIAs the research, underwriting, and monitoring to move real estate alternatives from a sponsor pitch to a client-ready conversation, without adding headcount.
Book a Walkthrough of a Real ReportRIAs are being asked to allocate more client capital into alternatives, often without a dedicated real estate team. Sponsor decks and platform approvals only go so far. The real burden is everything after: finding the right opportunities, monitoring them, tracking milestones, knowing when to question a sponsor, and explaining performance to a client when something goes wrong. That work still lands on the advisor, deal after deal.
Six components, one engagement
Sponsor and fund underwriting with rebuilt assumptions and fee normalization, plus ongoing milestone tracking and the questions to bring back to a sponsor.
Real estate allocation frameworks sized to the firm and its clients.
Demand-side research and relative value analysis across real estate strategies, built from the buyer's side, not the seller's.
Documented, decision-ready work product for IC review.
Advisor- and client-facing deliverables under the RIA's own brand.
Client-ready alternatives education, built for advisor delivery.
Meet Steuart AI
Most investors in alternatives rely entirely on what the sponsor tells them, like buying a house based only on the seller's description. Steuart AI is the independent second opinion: the comps, the inspection, the flood map check a buyer would insist on before committing capital. Named for Sir James Steuart's supply-and-demand thinking, it goes as deep as a client needs on a single market or property type, on demand.
Model-based, forward-looking estimates — not investment advice. Full ranking of all 9 sectors and methodology in the Cross-Asset Report.
The data center shortage is real. The pricing already assumes it.
Operational US data center capacity has nearly tripled since 2021, and the construction pipeline has grown roughly 14x over the past decade. Steuart AI flags this as the setup for an underweight, not a buy signal — trophy assets already clear sub-4% cap rates, pricing in the AI build-out as a near-certainty.
9,432 MW operational in 2025 (+36% YoY), plus 5,994 MW already under construction. Source: CBRE, Cushman & Wakefield.
Getting Started
For RIAs new to alternatives who need education and deal-by-deal guidance.
Active Desk
For RIAs already allocating who need ongoing underwriting and monitoring at volume.
For discussion purposes only. Not an offer to sell or solicitation of securities. Not legal, tax, regulatory, or investment advice. EM Capital does not act as a placement agent. The RIA retains final investment authority.
Elite Broker Blogs
━━━━━━━━

Your Gross IRR Is Not Your Return
Your Gross IRR Is Not Your Return
A single-class, no-promote fund still absorbed ~49% of LP capital. Here's the math, and how to run it yourself.

Most private real estate investors underwrite the deal. Almost none underwrite the sponsor. 1 Allocators will spend hours on the market, the cap rate, the rent comps, and the operator's track record, and then accept the fee schedule as boilerplate. It is not boilerplate. It is the part of the offering that most reliably moves what you actually keep.
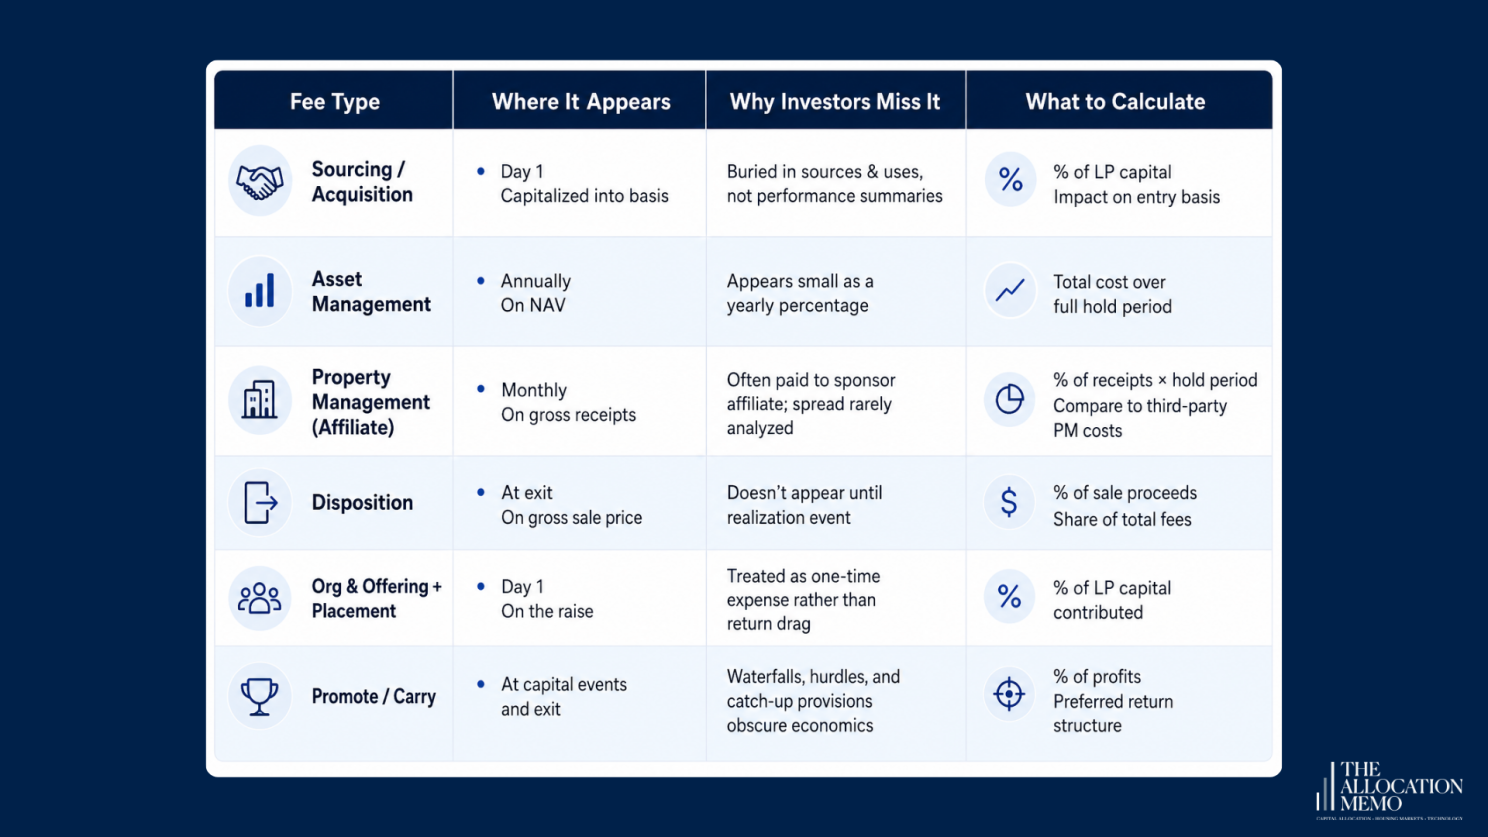
Fee opacity is not usually deception. It is structure. Six features make the fee stack hard to see on a deck:
Timing. Day-1 fees, hold-period fees, and capital-event fees never appear on the same line.
Basis. A "1%" fee means nothing until you know 1% of what, gross assets, NAV, equity, revenue, sale price, or profit.
Affiliate routing. Property management and disposition fees often flow to an entity the sponsor controls, with a retained spread that is rarely disclosed.
Gross-vs-net. The headline IRR is almost always a gross or pre-some-fees number.
Waterfall mechanics. Promote, hurdle, catch-up, and clawback interact in ways a summary table hides.
Exit fees. A disposition fee on gross sale price does not register until year seven, when the check arrives smaller than expected.
I’ve seen this from both sides. When I raised my first fund, I invested pari passu alongside my LPs. No promote. The business wasn’t at a stage that justified one. Most sponsors don’t think that way.
Sponsor fees are not a footnote. They are an underwriting variable. The right question is not "What is the sponsor projecting?" It is "What reaches the LP after fixed fees, affiliate fees, promote, timing, leverage, and exit costs?"
Fee drag isn't a disqualifier. It's a sizing input. But you cannot size for something you have not modeled.
Mechanism 1: Fixed-fee drag, no promote.
We recently underwrote a Reg A Tier 2 single-family rental fund: single share class, no carried interest, REIT 1099-DIV tax treatment. The kind of structure that looks investor-friendly on the cover. Over a modeled seven-year hold, the disclosed fee stack absorbed roughly half of LP capital:. Convert traffic into leads
Blogging helps your website to be more than just a place for people to visit. It gives them the opportunity to interact with your business in a way that isn’t possible through other forms of content on your website. By blogging, you have the ability to help drive traffic back to your website and convert that traffic into leads. For example, if you blog about an important industry event and share it on Facebook and Twitter, you can expect a boost in new signups to your email list or visitors to your website.
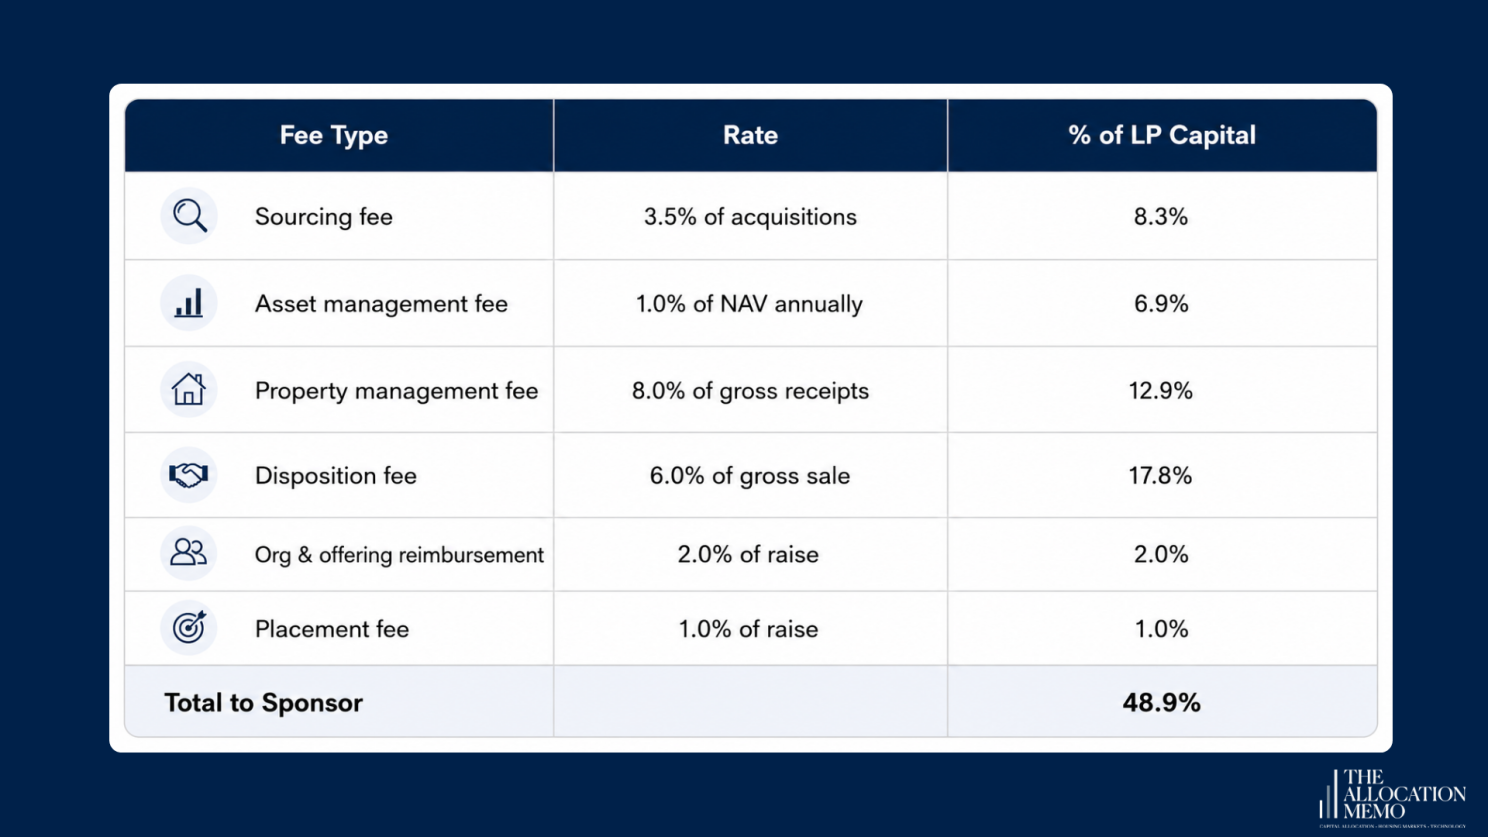
The bottom line 49% of LP capital invested translates into Sponsor fees.
(EM Capital underwriting analysis, anonymized SFR Reg A Tier 2 fund, 2024)
The single largest line is the disposition fee, nearly 18% of everything invested, and it does not appear during the hold. It shows up at exit, on gross sale proceeds. The fund's modeled LP net IRR after this stack was 8.8% over seven years.
That is not a disaster. But it is the point: a single-class, no-promote structure can still carry major fee drag. The absence of a carry is not the presence of alignment.
Sponsor economics here scale with NAV, gross receipts, and gross sale proceeds. Three rate cards that grow regardless of LP outcome.
Our internal note was blunt: the load "cannot be negotiated; size accordingly.
Mechanism 2: Promote drag, no floor.
Fixed fees are one version of the problem. The waterfall is the other, and it is illustrated cleanly by a public filing. Cardone Capital Equity Fund V, LLC raised $50 million under Regulation A+ from more than 2,200 individual investors, completing its raise in September 2019 across five multifamily properties. Per the fund's Form 1-K for FY2020 (SEC File No. 024-10865, accession 0001477932-21-002205, filed April 12, 2021): the manager's acquisition affiliate is paid 1% of asset purchase price and 1% of disposition price, and the company pays an annual asset management fee of 1% of capital raised.
Then the promote. Class A members hold a 65% profits interest; the Class B interest, held entirely by the manager, is a 35% profits interest, with no preferred return hurdle. The 1-K's own language confirms profits are allocated "65% to the Class A Members… and 35% to the Class B Interests", from the first dollar of profit, with no minimum return to LPs first. The fund's reported since-inception net IRR to Class A investors was 7.89% as of December 31, 2020.
Set against widely used institutional convention, a 20% promote above an 8% preferred return, the structural difference is the absence of the hurdle. The hurdle exists so the sponsor is paid for outperformance, not for showing up. Without it, the manager participated in 35 cents of every profit dollar during one of the strongest multifamily appreciation runs on record, while Class A net IRR landed just under 8%.
(All Cardone data points were verified directly against SEC EDGAR. The fund is named here only to illustrate a publicly disclosed fee mechanism; nothing here is a recommendation.)5. You can repurpose blog content for social media
This is a great way to get more mileage out of your blogs and increase traffic. However, it's important to use the right type of content on Facebook. If you write about topics like parenting, personal finance, or food, they might not be as relevant on Facebook as other types of posts.
If you are looking to make money online, affiliate marketing has become one of the most popular. Affiliate marketing allows bloggers to earn commissions by promoting products and services from others. The blogger does not need to own any product or service to be able to promote them. All he needs is a link to the product or service which he wants to promote.
The Gross-to-Net Fee Stack Audit
Two mechanisms, one discipline. Here is the method we run on every offering.
Step 1: Rebuild the gross case. Establish invested capital, gross asset value, debt, NOI, distributions, refinancing proceeds, sale proceeds, and hold period. You cannot measure drag against a number the sponsor controls; rebuild it.
Step 2: Map every fee line. For each fee, record the recipient (sponsor, manager, affiliate, broker, property manager, third party), the rate, the calculation basis (gross assets, NAV, equity, revenue, sale price, or profit), when it is paid, whether offsets exist, and whether the LP has any catch-up, hurdle, clawback, or preferred-return protection.
Step 3: Time the fees. Sort them into Day-1 (acquisition, sourcing, org/offering, placement), hold-period (asset management, property management, admin, servicing, financing), and capital-event (refinance, disposition, promote, catch-up). An annual-average fee load hides the exit-weighted ones, which are the ones that hurt.
Step 4: Calculate the three denominators. Express drag three ways: total fees as a % of LP capital, total fees as a % of gross profit/surplus, and the gross-to-net IRR spread. One denominator flatters; three triangulate.
Step 5: Stress the economics. Re-run the LP net IRR under at least three sensitivities. In the SFR case above, the math is unforgiving: each 50bps of exit-cap expansion costs the LP roughly 250–300bps of IRR, and a downside of 1.5% rent growth with a 6.5% exit cap turns the 8.8% base case into a negative 1.6% IRR and a 0.91x multiple, capital not returned, after fees. 2 Stress exit cap +50/+100bps, NOI or rent growth down 10%, and a delayed or unavailable refinance.
Step 6: Convert into a decision. Classify every sponsor assumption as accepted, adjusted, challenged, or unsupported, then translate the output into allocation sizing, sponsor questions, monitoring items, and a proceed / conditional / avoid view.
How this fits EM Capital Management's process
Fee underwriting is not a standalone exercise. It is one move inside a normalization process that converts sponsor decks, PPMs, models, and reporting packages into a documented allocator view: decision context → material intake → six-lens normalization → independent analysis → risk escalation → EM Capital Management View.
The normalization runs across six lenses: Track Record, Economics, Fees, Liquidity, Reporting, and Alignment.
Fees is one lens, but it is where the discipline bites: every sponsor assumption is either accepted, adjusted, challenged, or unsupported, and the fee stack is where that distinction most often changes the answer.
In the SFR case, the structure scored clean on form and the fee load scored heavy, and the combined output was "proceed with conditions," not a core allocation.
What this means for allocators
Stop relying on headline IRR. It is a gross or pre-some-fees figure almost every time.
Ask for the full fee schedule, not the waterfall summary, including every affiliated-party transaction.
Rebuild the model on fee timing, not annual averages. The exit-weighted fees are the ones that move the result.
Compare sponsors on gross-to-net spread, not only asset class or geography.
Treat fee drag as an allocation-sizing input. A high-fee sponsor can still be worth it, but only at the right size.
The fee stack is not a disclosure item. It is part of the investment.
Decision Snapshot - Before you wire capital
Complete fee schedule, every line and every recipient
Waterfall with preferred return, promote, catch-up, and clawback
Affiliate transaction schedule (and retained spreads)
Sponsor co-investment, stated in dollars
Track record stated net of all fees , audited where available
Distribution coverage (operating cash flow vs. offering proceeds)
Exit / disposition fee calculation, on the right basis
Gross-to-net IRR bridge
Gross returns are what sponsors advertise. Net returns are what you take home.
The gap between them isn’t a rounding error. It’s a structural feature of the offering. Know it before you sign.
If you are evaluating a private alternatives offering and want the gross-to-net bridge rebuilt from the filings, that is the work we do, independently. No sponsor compensation. No placement-agent relationship. Allocator-side work product.
Schedule a call using this link to get in touch with our team: https://emcapllc.co/contact
Where the Fees Hide:

COMPANY
FOLLOW US
